


Over the last months, volatility across financial markets trended lower, as the CBOE Volatility Index (VIX) shows. The index is near the bottom of the COVID-19 crisis.
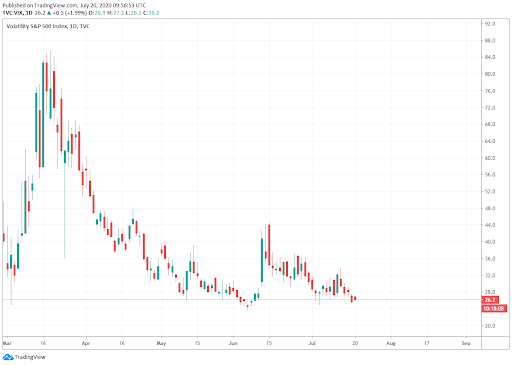
Low volatility usually is accompanied by higher equity prices, as it has been the case. Crude oil prices have stabilized near the top of the rebound from record low levels. Over the last weeks, the rally in oil stopped. However, downside corrections have been limited.
Taking into account the price of the West Texas Intermediate (WTI) has been doing something completely different from what it was doing months ago: limited moves in a tight range. Over the last thirty days, WTI traded in a $6 range; considering only July, it is around $3.5.
When the pandemic forced lockdowns all over the world, economic expectations sank, and crude oil started to drop sharply. Then Saudi Arabia began a price war with Russia (March 8), pushing oil further lower. In those old days, a daily price range of 1% would have been considered a very quiet day.
Has it gone too far?
From a fundamental perspective, the rally from the April low had two key developments. The price war came to an end with a historic deal between the OPEC and its allies to cut production, and risk appetite returned to financial markets.
The production cuts, as long as it remains in place, should offer some support. However, crude oil prices also appear to need positive expectations about the global economy (namely crude demand).
Does the current situation provide enough for a run above $40?
WTI trading at a popular level

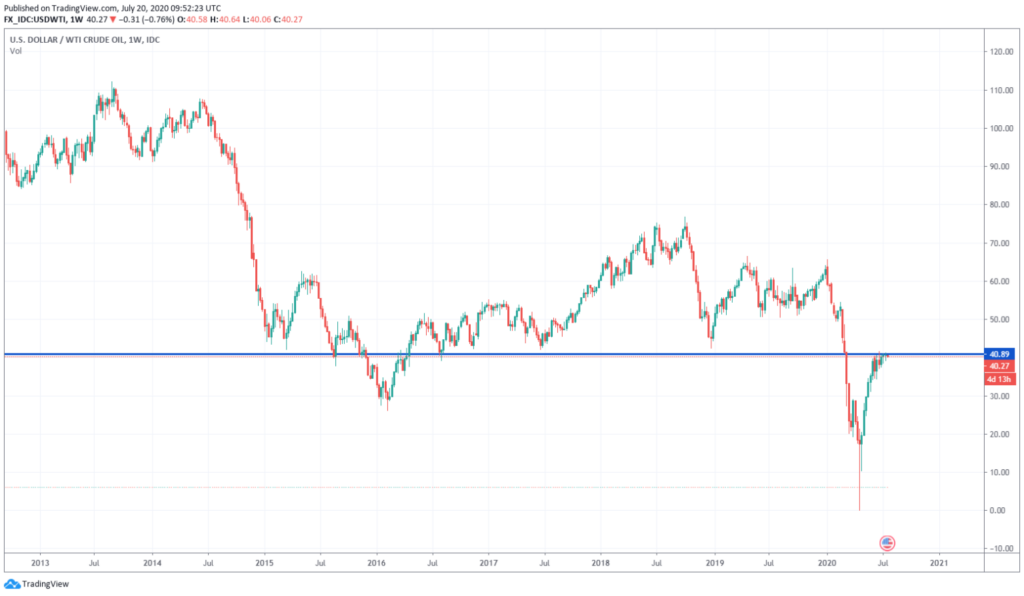

The area where crude oil (WTI) is currently trading, as seen in the weekly and monthly chart, is very relevant from a long term technical perspective. It is not only the recent peak, but it is the area of 2005, 2017, and 2018 lows, and it was a level of consideration back in 2008 and during the nineties.
In the short-term, technical analysis suggests that a consolidation above $41 should trigger more gains toward the next strong barrier seen at $44/46 and then $50.
On the flip scenario, a bearish correction to test the critical support at $36 seems likely with a close under $38.5. While above $36, the move lower could be seen as a correction, but a break lower would sign that it has peaked, pointing to more weakness ahead.
The current equilibrium around $40 will likely be challenged in the near term. July and August are not usually quiet months for oil. Also, with the extraordinary period the world is living at the moment, too much calm, it does not look normal.
