


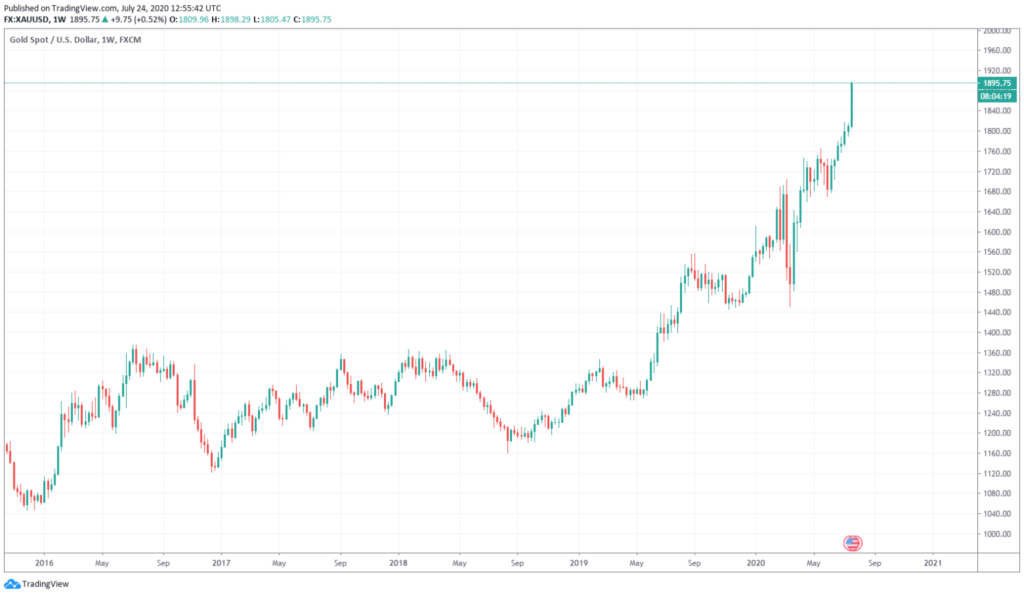
Gold rose a hundred dollars in the week. How much fuel does the rally have? When everybody sees prices moving in one direction, odds of a surprise increase
On Thursday, the yellow metal reached a multi-year high for the fourth day in a row. XAU/USD peaked slightly below $1,900/oz and then pulled back modestly. Practically all projections see gold prices moving to all-time-highs and beyond. How far can the yellow metal go without a significant correction? Where could it meet resistance?
Dollar’s bearish trend, a key factor
The rally in gold has many drivers, both technicals and fundamentals. Over the last few days, one key factor has been the decline of the US dollar.
While the charts point to further dollar weakness over the medium term, price action is not linear, so bearish corrections are likely. Practically all we read these days suggest more losses for the greenback and that we should buy the dips in pairs like EUR/USD and AUD/USD.
This rhetoric makes sense from a technical perspective, as those charts show positive trends.
Many analysts continue to see gold prices heading higher but recommend taking profits near $1900 and buying into corrections. For example, analysts at TD Securities expect gold to move to $2000 and above.
Their forecast is based on expectations of lower real interest rates in the longer-term. But they suggest taking profits “to protect against near-term adverse shock which, for instance, could drag inflation expectations lower faster than nominal rates, and we will look to tactically add to our gold going forward on any significant consolidation lower.”
Which could be the main risk here? Probably a negative shock to market sentiment that could boost the US dollar. Even in such a shock, gold prices could keep rising, considering that central banks might loose monetary policy even further.
Long gold is becoming a crowded trade that could slow down the advance. Also, most technical indicators from small to large timeframes are showing extreme overbought readings.
Even though an asset could maintain overbought conditions for a long time and still keep running, they could precede important corrections.
There is another “informal” indicator that warns about the next legs in gold. It could be named the contrarian index: when there is practically a public unanimous opinion among analysts and economists about where the price of an asset is going, the odds of a move against that general opinion start to grow.
Is this the case with gold? Maybe, maybe not. Even if everybody thinks it will rise, it does not mean it will, much less in a systematic or relentless way.
