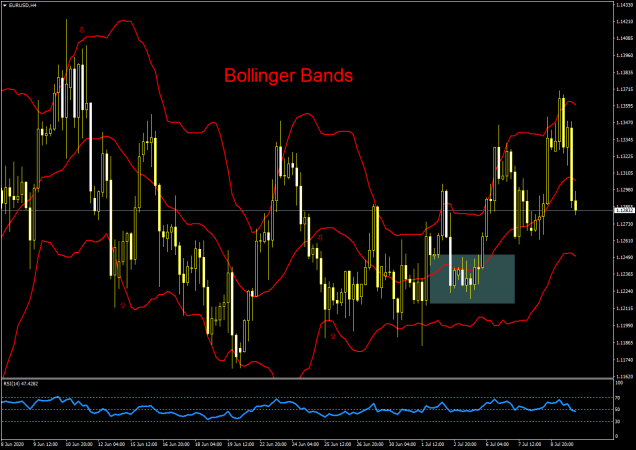
Bollinger Bands is an indicator that helps to visualize how high or low prices are on a relative basis. The name comes from John Bollinger who developed the indicator. The Bollinger Bands are plotted as a set of three lines: 1) an upper band 2) a middle line and 3) a lower band. The middle line is a simple moving average. The upper and lower bands are located +/- a certain number of standard deviations away from the moving average.
A standard deviation is a mathematical formula that measures volatility. The bands expand and contract, following price action. If market volatility increases, the bands move away from each other, and when volatility decreases, the bands move closer to each other.
Usually, platforms use as default values the 20-period for the moving average and two standard deviations for the bands. Technical analysts can customize these parameters in order to adapt the indicator to the assets under study.
Bollinger Bands could be used to determine entry or exit levels for a trade. If the price consistently reaches or crosses the upper band, the asset is considered to be overbought and could be a sell signal. On the other hand, if the price touches or crosses the lower band, the market is oversold and that could be used as a buy signal.
The Bollinger Bands are often used to gauge trends. As bands move in sync with price action, they create an accurate trending envelope. A significant widening of the band (high volatility) might signal the trend is ending. Conversely, a significant narrowing of the band (low volatility) could signal the beginning of a new trend.
Bollinger Bands are not predictive as they are based on historical data. They react to price action but don’t forecast price changes.
Bollinger Bands are best used in combination with other technical indicators as part of an integral trading part.


