


When a trader opens a position he is betting that the price will go into a certain direction. Those decisions could be based on fundamental analysis, technical analysis, or impulse.
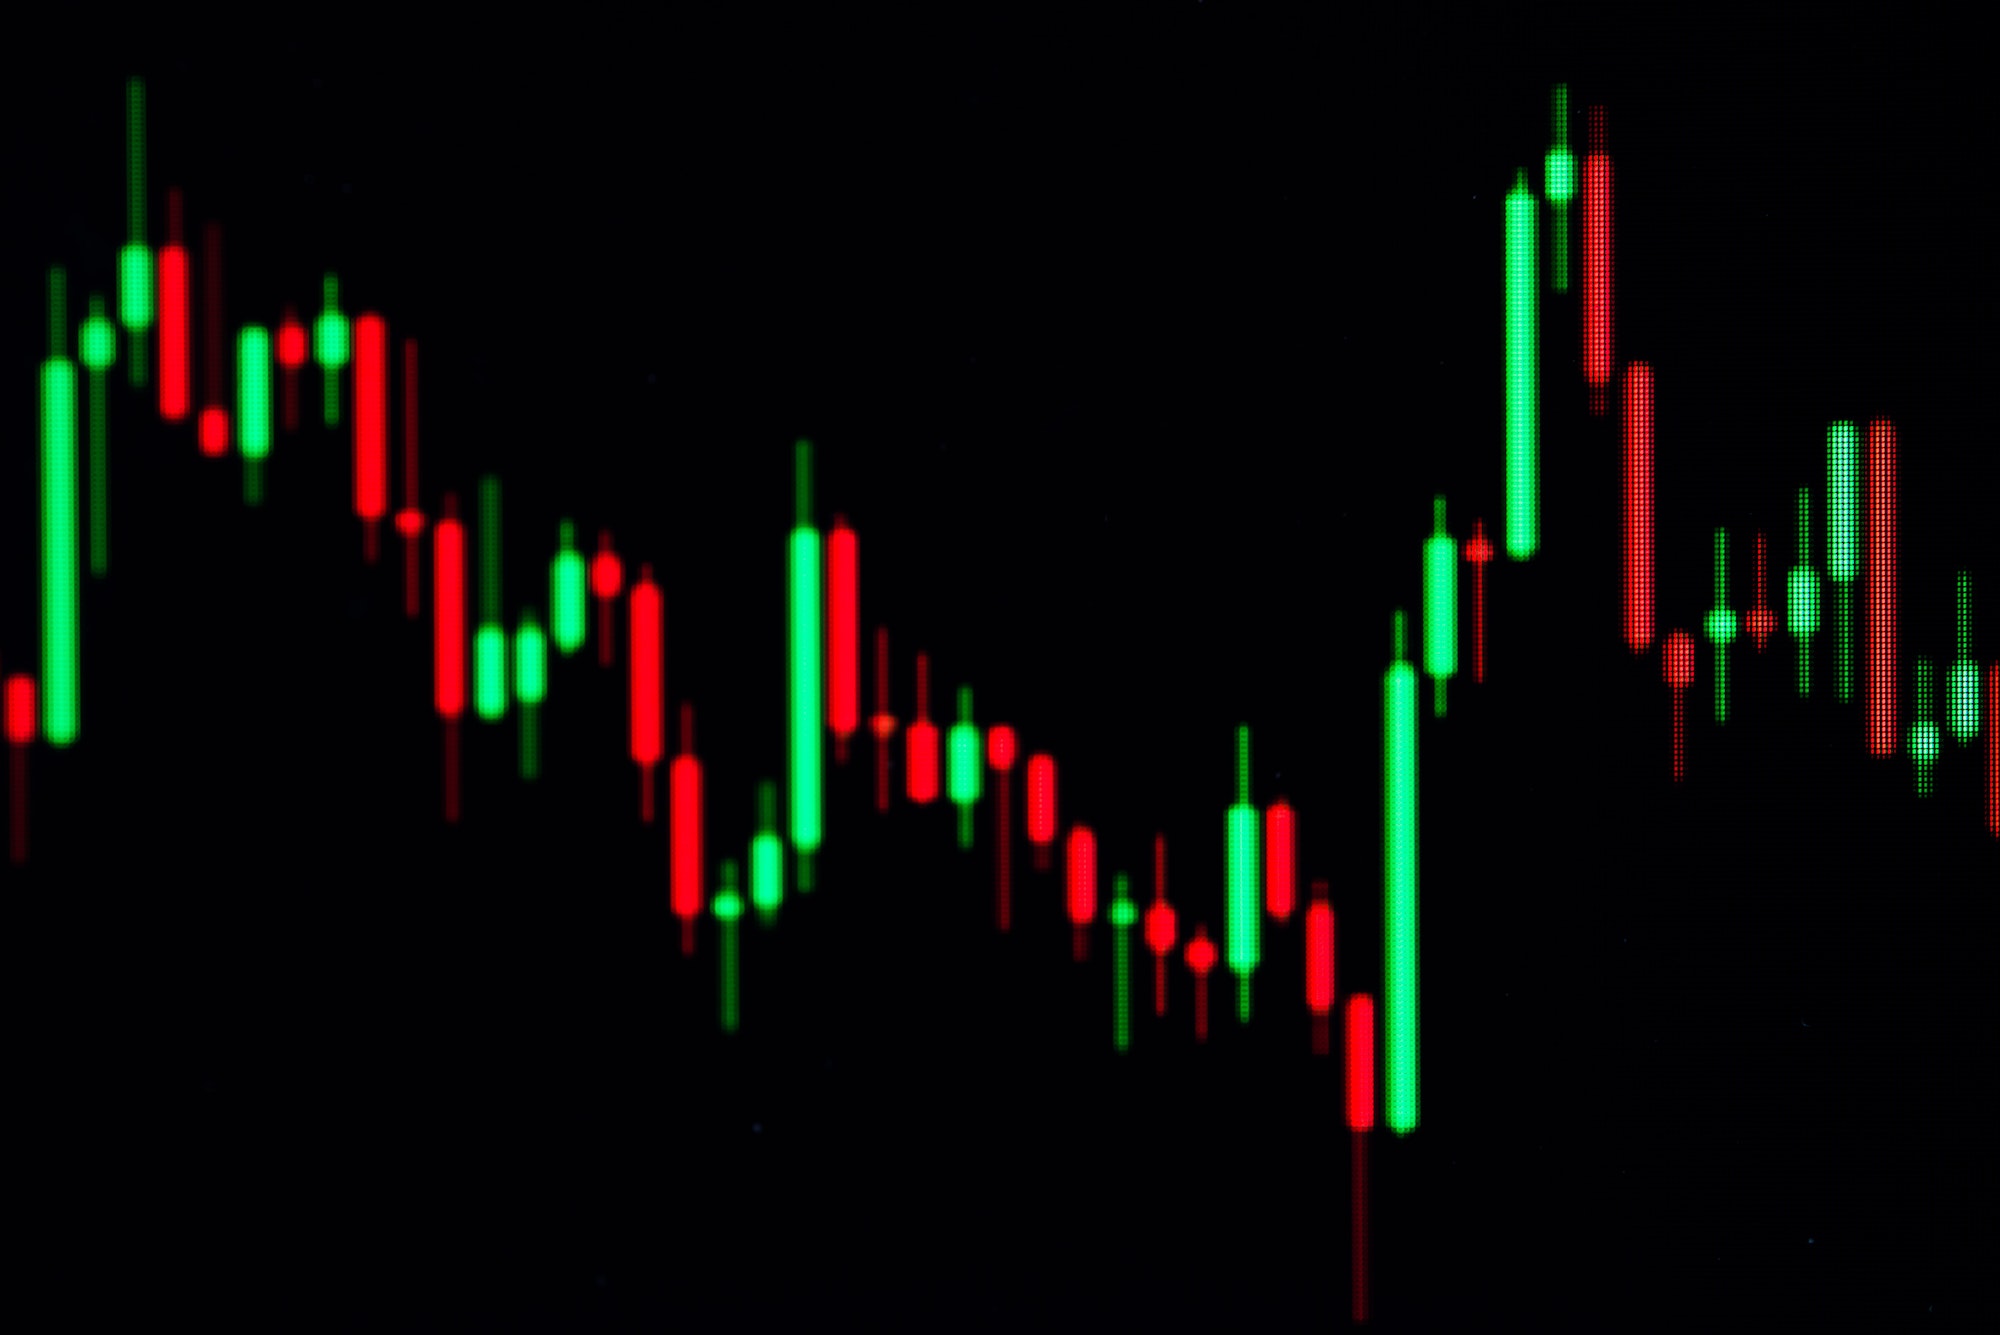
Technical analysis uses a range of tools, one of them being candlestick patterns. Like all the tools technical analysis offers, candlestick patterns are used to predict where the price is going. Each candlestick displays the high, low, open and closing prices (input) in a specific period of time. The candle is formed by a body and shadows that represent that period of time and the final shape depends on the input.
The study of candlesticks charts aims to identify different types of candles and also patterns that can help predict future price action based on past action.