


The S&P 500 index has risen 50% from the March low, reaching new all-time highs six months later. While the long-term bullish trend remains intact, for the short-term, the chart shows a different picture. Many analysts have started to warn about increasing odds of a market crash. Can this correction be the beginning of a collapse?
There are some red flags of an upcoming crash in the stock market, but those who predict such a collapse also warn that the timing is unknown. And even during the course of a crash, markets go up and down and have strong rebounds. Movements are never linear.
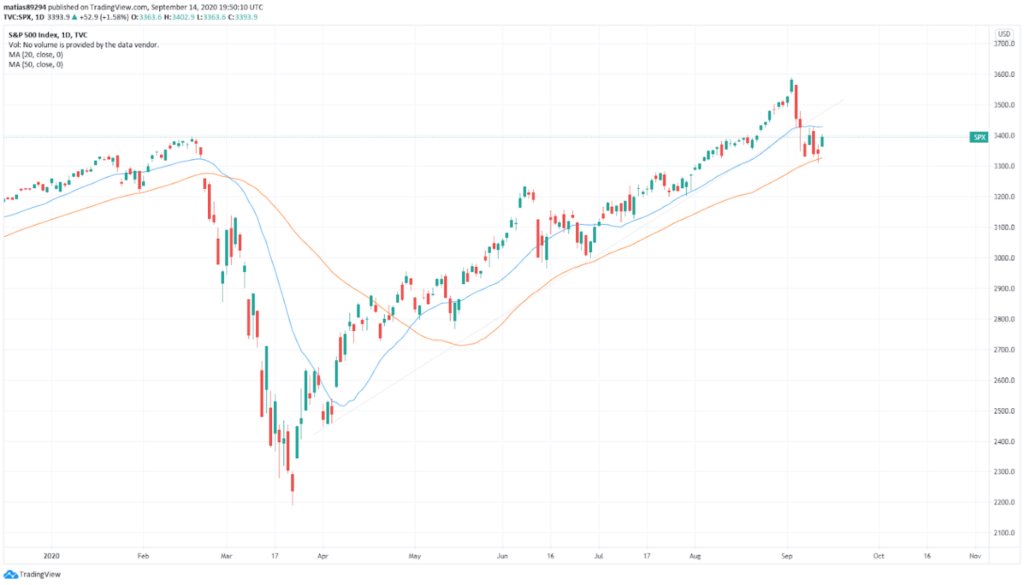
The S&P 500 has found support so far at the 50-day moving average. A break lower would clear the way to more losses and to an extension of the downside correction. While, if it manages to remain above, the upside will remain favored and a breakout of 3,430 (20-day moving average) would make a visit to the record highs more likely.
What do VIX, IPOs and options tell us?
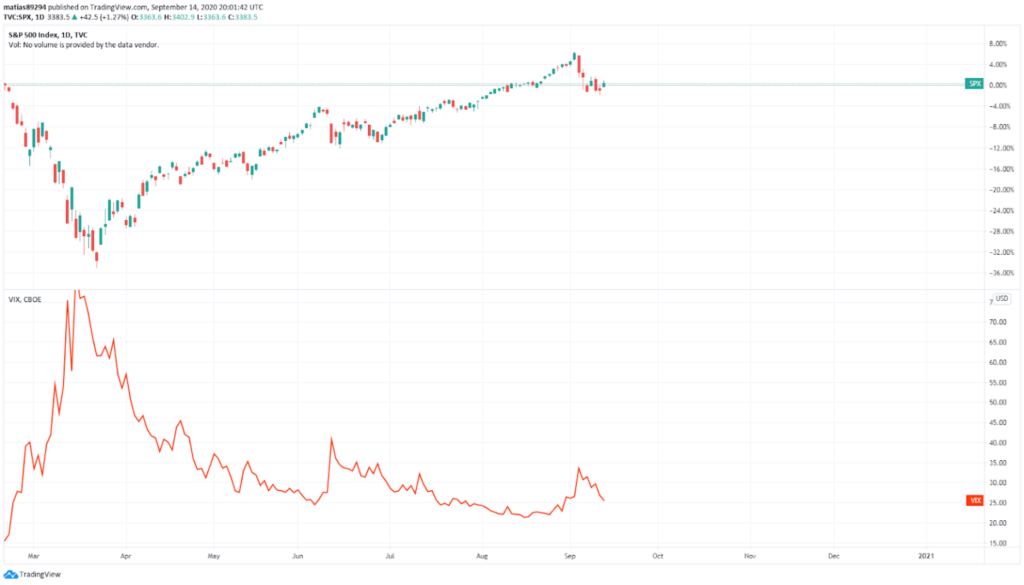
The correlation between the VIX and the S&P500 could help to assess the market. Usually, when volatility decreases, the S&P 500 moves to the upside, which is a negative correlation. However, days ago, volatility jumped and so did equity prices, not the normal. And more recently, volatility moved lower in tandem with the S&P 500.
That could be a negative sign for the index. Instead, a positive sign for markets would be if the VIX continues to drop and the S&P consolidates or moves higher.
Investors could also take some cues from Initial Public Offerings (IPOs). The best time, in terms of pricing for a company to sell its own shares or to become public, is when optimism is at the top. In other words, when prices are high is the best time to sell. Over the last months, the amount of IPOs have constantly been rising. As reported by MarketWatch, the US IPO market “is gearing up for its busiest week since May of 2019.”
“An estimated $60 billion in initial public offerings that are headed for the stock market this year could be an all-time record. That is raising eyebrows for many astute market veterans because historically when IPOs flood the market what follows are big declines,” wrote Brad Lamensdorf, chief market strategist of The Lamensdorf Market Timing Report.
We can add to this that US junk-bond sales reached record levels during July and corporate investment-grade issuance is at all-time highs. The high demand for those papers is being driven by investors looking for yields in a world where government yields are at ultralow levels.
The Wall Street Journal mentioned on Monday that “investors are trading stock options and chasing fast-rising shares at record rates, an activity that’s expected to jolt markets through the coming election. A surge in options trading targeted at giant tech stocks by both small and large investors is magnifying the market’s ups and downs.
Investors are also simply buying shares that are going up, a strategy that can create their own wild swings in the market.” A spike in options volume is another precondition for a sharp decline in the equity market.
Increasing interest from small investors is another factor that could be anticipating something more than a correction. Too much interest from retail investors would not necessarily lead to a crash in markets, but it is something to watch.
“Retail investors have opened a huge number of accounts at online brokerages this year. Charles Schwab, TD Ameritrade, E-Trade, and Interactive Brokers all experienced a big boost in activity, while millennial-favored Robinhood saw a historic 3 million new accounts in the first four months of 2020. Red flags were raised after those retail investors piled into riskier segments of the market,” explained Weizhen Tan, Markets Editor at CNBC.
It looks like it is coming, but…
Harry Dent, the founder of Dent Research, warned that stocks are nearing a day of reckoning. His conclusion comes from considering several variables that include exorbitant debt, accommodative monetary policy, diminishing central bank efficacy, aging demographics, and lofty stock and real estate valuations. “When this happens, you don’t get a 30 or a 50% stock correction. You get 80 to 90.”
Is it a bubble or not? Is it just an unsustainable rally that will have its healthy correction once in a while? The long-term bullish trend is still in place, but so it is the short-term bearish trend. In any case, now does not look like a good entry point for long positions, considering current price levels and risks ahead.
