


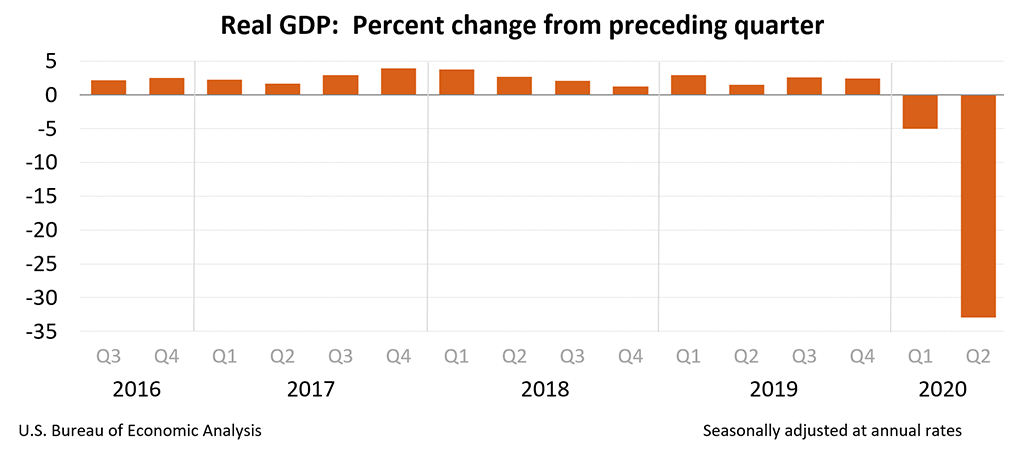
The United States recorded its worst-ever growth figure in the second quarter. The lockdowns from COVID-19 triggered an economic contraction not seen before in recent history. Last week data showed US GDP dropped by an annual rate of 32.9% (Q2 advanced estimate).
US numbers look even more dramatic than they really are because they are presented differently. GDP is an important indicator that tells a lot about the economy but doesn’t show the whole picture – and it could lead to wrong conclusions. Following this catastrophic figure, third-quarter reading will likely show the best performance ever, but that does not mean the best economic condition.
The report triggered some critics about how overrated is GDP as an indicator, and it has also led to quick and erroneous comparisons between the US and other countries.
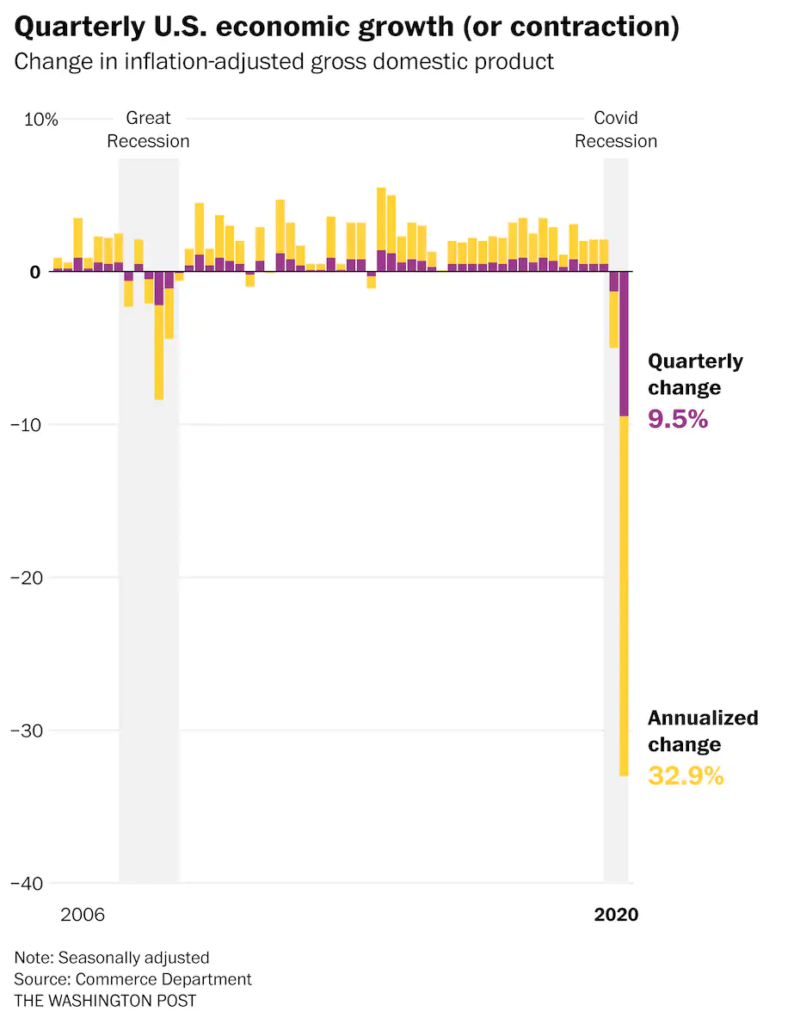
In the US, quarterly GDP is presented at an annual rate (supposedly to allow simple comparisons with other periods). Removing the annualization from the -32.9%, still gives a shocking number: -9.5% (more comparable to other countries).
“Annualization assumes the businesses closed this quarter would remain closed and that just as many more would close in the third quarter. And we’d expand the closures again in the fourth quarter and again in the first quarter of next year. In other words, take the devastation you saw in the past three months and multiply it by four”, explained Andrew Van Dam, a reporter from the Washington Post.
The Q2 report will be revised in August and again in September and maybe later too. The advance estimate of Q3 will be released in October. Readings are subject to revisions that usually don’t change the direction and do not affect markets, because by that time data is already “old.”
During the second quarter, most of the world’s economies started to reopen. Still, some restrictions remain in place and the situation is far from normal. According to some analysts, economics reports from July point to a US GDP growth rate of above 20% (annualized), that would be a new record. Those estimates will probably be among the best in the world. However, just as the contraction looked worst because of the way it is presented, same situation applies to the rebound. It won’t be as good as it looks compared to other countries, but still it will be quite positive.
The coronavirus pandemic has created noises across all economic indicators. What matters the most, as of now, it’s how the economy will be left and how long it will take for it to come back to pre-crisis levels. In other words, the long-term damage. A way to assess that, is to see how long it will take for the unemployment rate to return to pre-COVID state (speed of the recovery) and what would be the new level of the natural rate of unemployment (long-term damage).