Would you buy a share of a company that has doubled its value in six months and is now worth the entire annual GDP of Italy? Or would you buy an underperforming stock, based on the hope that it will catch up?
US stocks have staged impressive comebacks over the last months. Out of the main indexes, the S&P 500 is up 4.8% in 2020, having rallied 54.4% from the March bottom, while the Nasdaq Composite gains 25.5% YTD with a stunning 69.9% rally from 2020 lows.
However, the rally has not been even. The Dow Jones is still down 2.3% year-to-date (although up 52.6% from its March low), with banks and other sectors lagging.
Could those sectors underpin the market when the economy fully recovers? Well, that is another question. Will the economy fully recover? That seems unlikely in the medium-term. A full-speed recovery would need for some industries to have stellar performances, offsetting long-term damage in others. In simple, the Amazons would have to keep it going in real business growth to absorb the severe contraction in Boings.
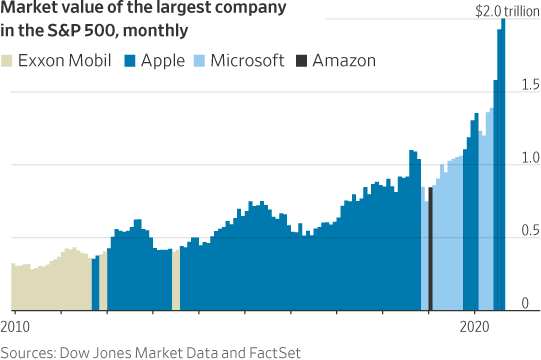
The value of Apple reached two trillion this week. A new record not only for Apple but for Wall Street. The company got there more than doubling its value from the March bottom.
“All a $2 trillion valuation really means is that Apple investors are now willing to pay twice as much for the same earnings outlook,” wrote Dan Gallagher, columnist of Heard on the Street at the WSJ.
Is it inflation? No. Is it a bubble? Maybe a small one. Is the rally likely to continue? We’ll see. An asset may look expensive, an asset may be relatively expensive, but people could remain willing to buy it, even at higher prices.
The timing of the Apple record is also odd. The rally in tech shares has boosted equity indexes. Still, the underlying situation is not the same for all companies and it certainly does not represent current economic conditions, and probably, neither expectations. The pandemic created the worst world economic contraction in recent history.
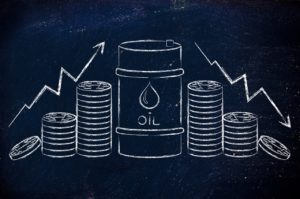
Even as the S&P 500 printed a new record close on Tuesday, revenues for companies listed in the index are almost 10% down from a year ago. Bank shares are down 30% on average so far this year, so it is the oil sector. Among the worst-hit sectors, there is tourism and aviation. Boeing is down near 50% YTD, and American Airlines 56%.
This uneven performance between sectors is a clear indicator of how the pandemic and the lockdown measures have created crises but also opportunities. It remains to be seen whether the tech sector will be able to sustain gains on solid foundations or if this bubble will burst on Wall Street’s face.